The problem
Email and SMS were bringing in about a third of revenue, but the flows doing most of that work were old. Welcome, cart, checkout and post-purchase dated from 2022 to 2024.
The audit mapped 79 flows, 593 steps and 934 campaigns, graded each flow, and had the findings challenged before anything was rebuilt. It found broken discount codes, broad and stale segments, and branches that overlapped and starved each other.
What I did
Built nine flows as 62 templates, from Figma to Klaviyo: Welcome (12), Abandoned Checkout (5), Abandoned Cart (4), Browse Abandonment (5), three post-purchase flows (8 each), Subscription Onboarding (5) and a new Winback (7).
Ran every template through my checking system before it went in: the standard footer, the brand fonts, every link, mobile safety, and a visual comparison with the design. The templates stay under Gmail's clipping limit.
Switched over cleanly. The new flows were built as fresh objects and turned on in June 2026, and the old ones were archived, so the two can be compared.
First build 20 April, live by 14 June, handed over 17 June.
The result
Revenue per delivered email, each new flow against the one it replaced. Baseline 1 February to 1 June 2026; new window 15 June to 12 July 2026.
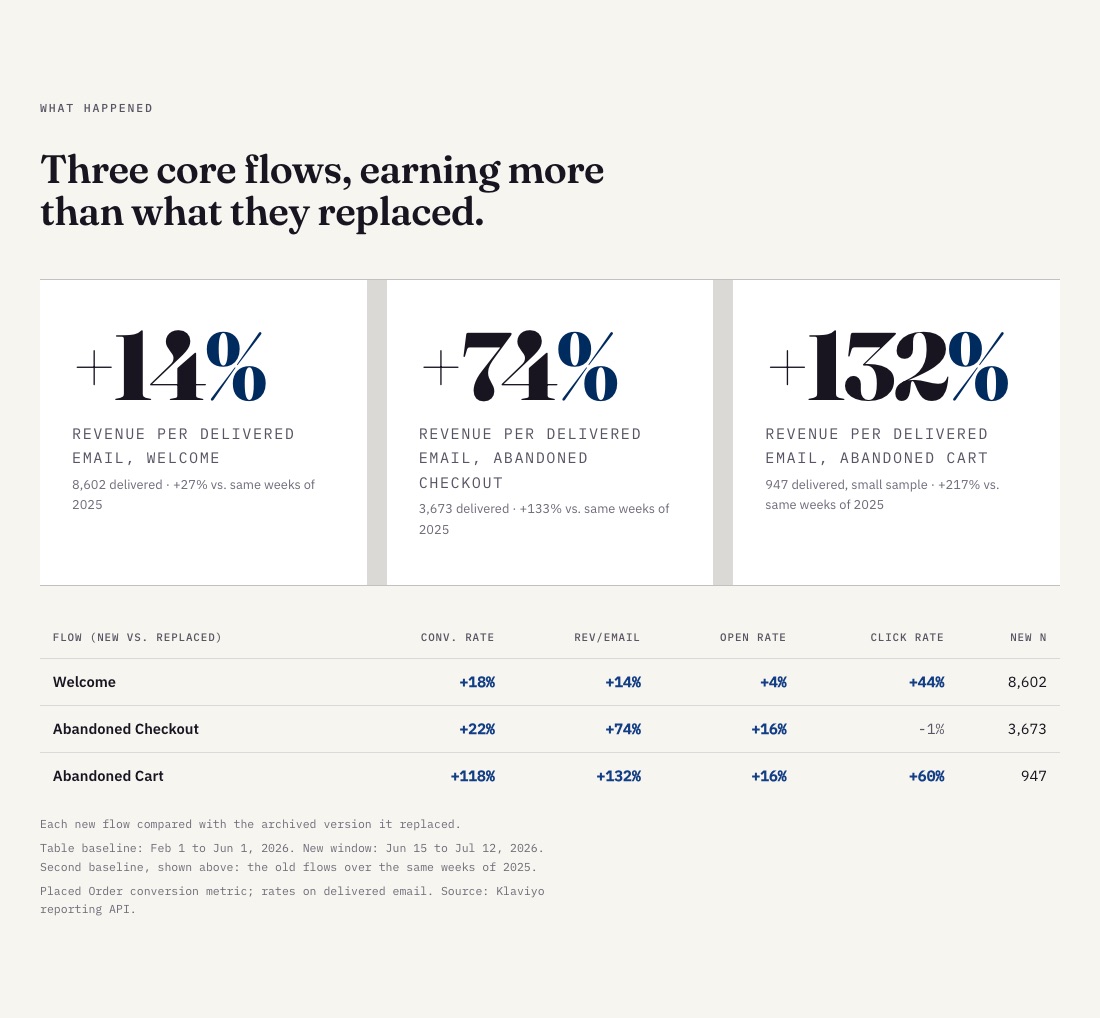 Klaviyo reporting · placed order · rates on delivered email
How to read it
- There was no holdout group. Traffic mix, offers and audience can still be in these numbers.
- Four weeks are claimed, no more. The engagement ended in July, and later results are not mine to claim.
- The cart figure is directional. It is the largest lift on the smallest sample: 28 orders.
- One thing was not solved. The first checkout email kept bouncing at a high rate, and the rebuild did not fix it.
- This is flow performance. It is not growth in the whole account.